
Azure Data Factory V2 - SSIS Deployment

How can we deploy SSIS in Azure Data Factory V2 ?

With Azure Data Factory V2 (Preview) you can deploy integration services packages easily and schedule them.
Prerequisite : Azure Subscription (You can use free trials subscription)

Steps to deploy SSIS in Azure

1. Login to azure portal and go to menu button and click on new as shown
Data Factory selection in the "New" pane
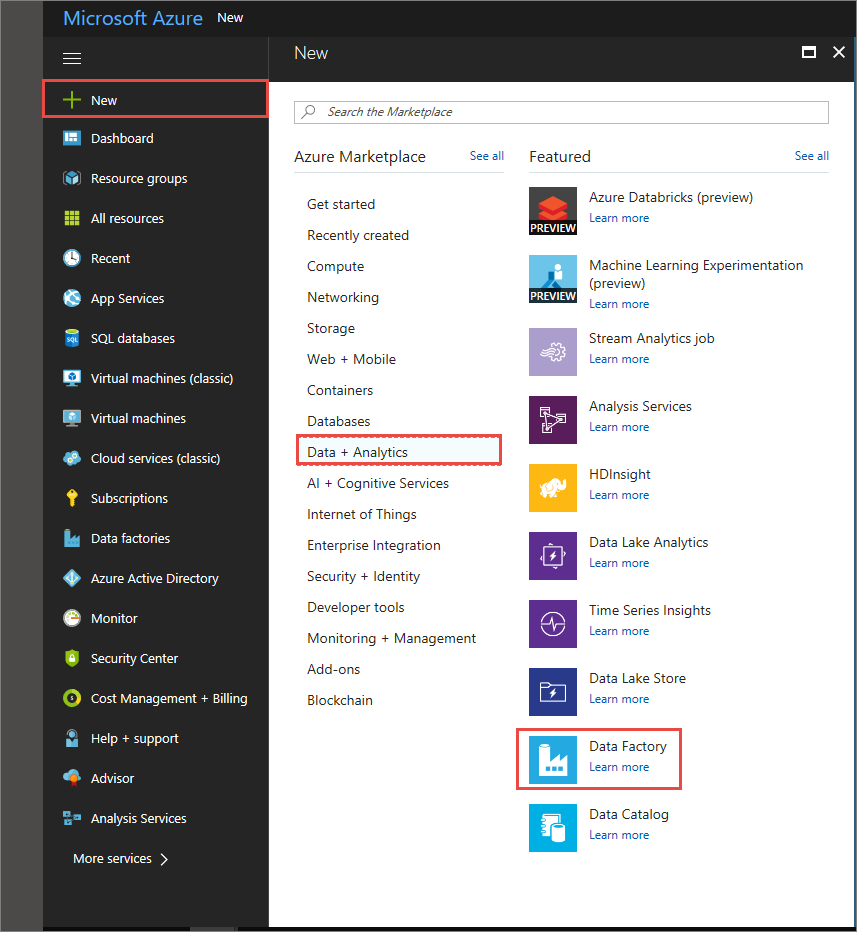
2. You can also search for Data Factory from the search box and click on it, you will be redirected to data factory creation page as below.
"New data factory" page
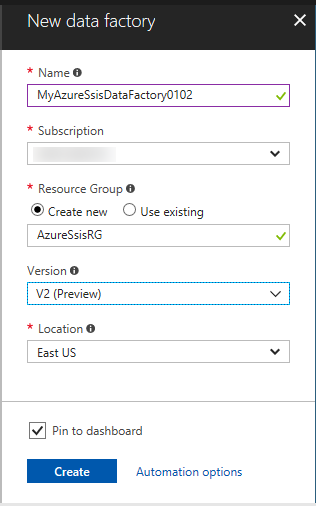
3. Fill in all the details (Version should be V2 (Preview)) and click on create.
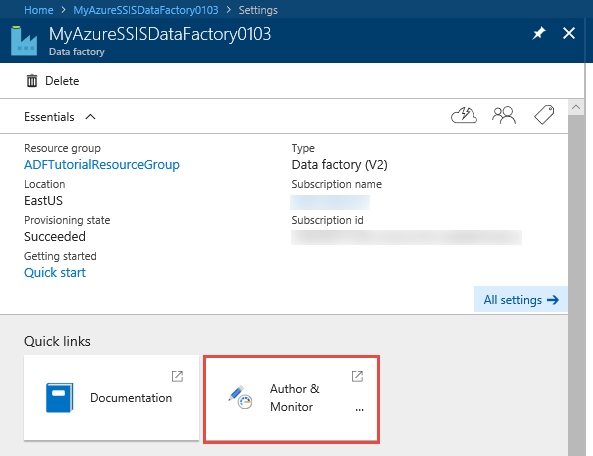
4. Once the data factory is created you can navigate to it and click on the Autor & monitor widget as below.
Home page for the data factory
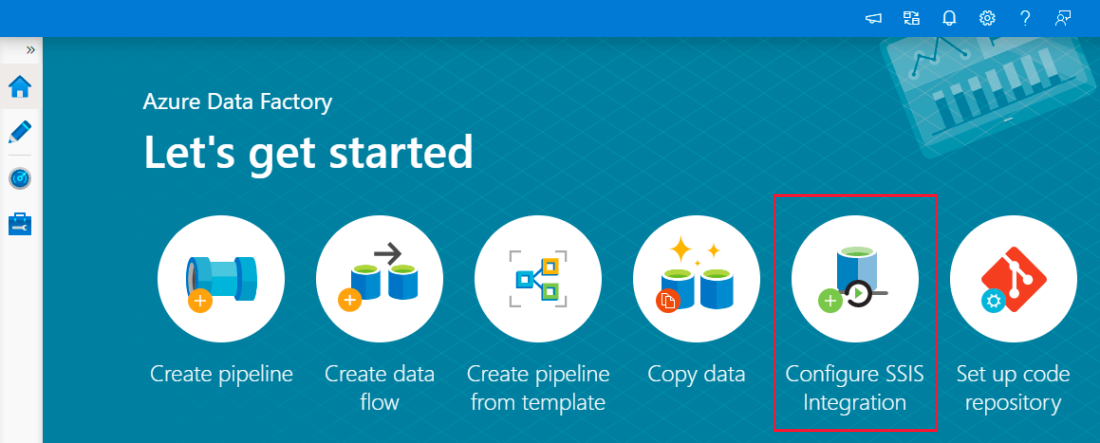
5. Now you will be redirected to authoring page where you will get multiple options like Create pipeline, copy data, configure SSIS runtime. Since we want to deploy SSIS packe we need to configure the SSIS runtime. Click on the same as shown below.
"Configure SSIS Integration Runtime" tile
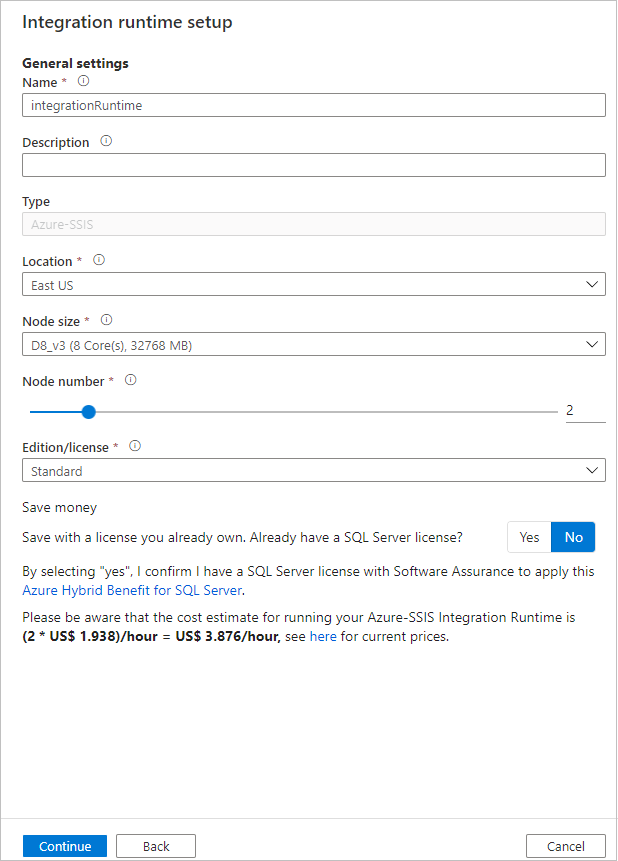
6. Fill in the desired details on the configuration on the run time setting page like name, number of nodes location etc as below.
General settings
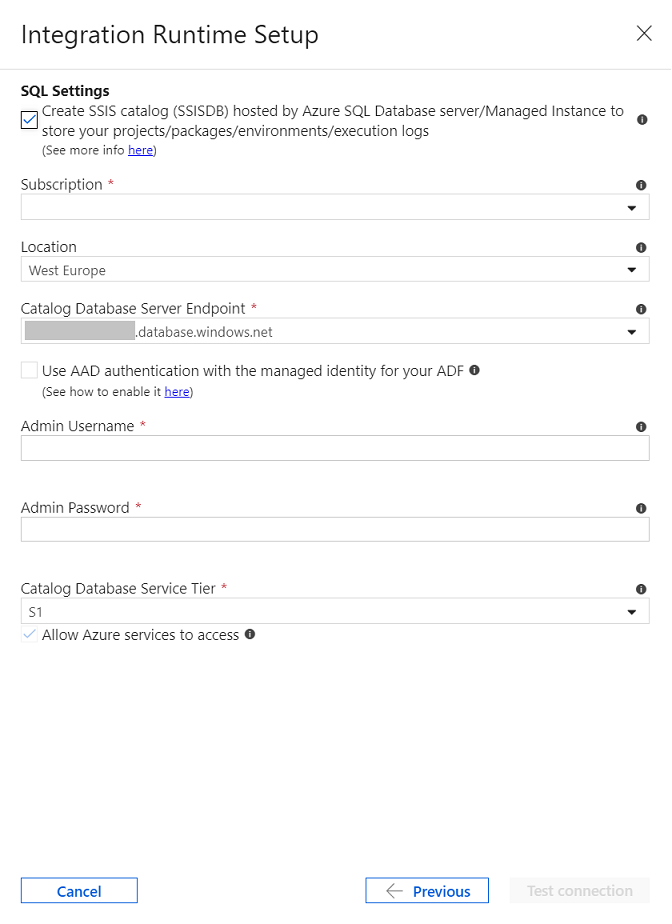
7. Click on next and you will get the SQL settings page, fill in required details (You need to have one Azure SQL database envisioned for the SSIS to be deployed, so create the same accordingly) .
SQL settings
8. Click on next and fill the maximum number of parallel execution per node.
Advanced settings

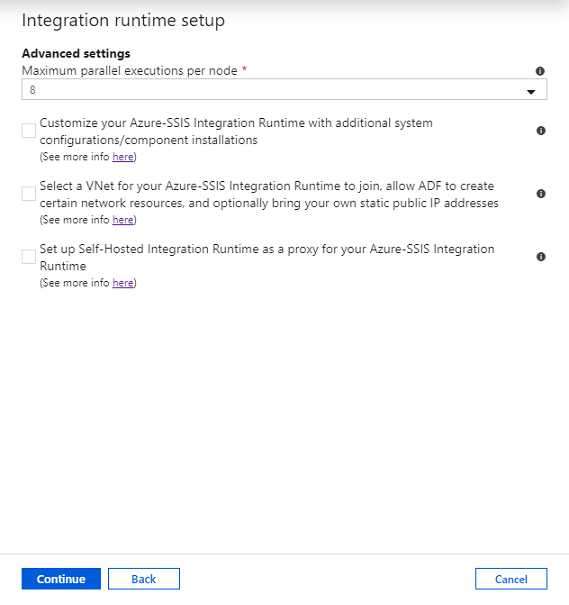
In case if you are using VNET then select the check box accordingly.

Finally click on finish. Now you runtime setup is completed, next you need to deploy the SSIS package.

To deploy SSIS package remember the SQL database details you had filled for SSIS runtime and fill in the same details while deploying through the SSDT.


Comments

Popular posts from this blog

DataZen Syllabus

INTRODUCTION TO DATAZEN PRODUCT ELEMENTS ARCHITECTURE DATAZEN ENTERPRISE SERVER INTRODUCTION SERVER ARCHITECTURE INSTALLATION SECURITY CONTROL PANEL WEB VIEWER SERVER ADMINISTRATION CREATING AND PUBLISHING DASHBOARDS CONNECTING TO DATASOURCES DESIGNER CONFIGURING NAVIGATOR CONFIGURING VISUALIZATION  PUBLISHING DASHBOARD WORKING WITH MAP  WORKING WITH DRILL THROUGH DASHBOARDS

MS BI Syllabus

Microsoft Business Intelligence Course Syllabus SSRS – SQL Server Reporting Services  Getting Started 1. Understanding Reporting (Authoring,Management,Delivery) 2. Installing Reporting (Native Mode, SharePoint Integration mode) 3. Building your first report  Authoring Reports 1. Developing Basic Reports (RDL,wizard,designer,datasource,dataset,formatting) 2. Working with expressions (expression to calculate value, Agg functions, exp for objects) 3. Organizing Data (Data Regions, Table, Matrix, Chart, List) 4. Advance Report (Parameter, drill down, drill through, links, 5. Report Model (Data Source, Data Source View, Model , Report Builder 3.0)  Managing Report ( Report Manager) 1. Managing Content (deploying report, folders, linked reports, datasources, value etc) 2. Managing Security (Item Level , Site navigation, localhost – sql) 3. Managing Server Config (Config Manager, Report Manager, Report Server DB)  Delivering Report 1. Accessing Report (Viewing...

PowerBI Interview Questions and Answers

Power BI Interview Questions – General Questions 1). What is self-service business intelligence? Ans: Self-Service Business Intelligence (SSBI) is an approach to data analytics that enables business users to filter, segment, and, analyse their data, without the in-depth technical knowledge in statistical analysis, business intelligence (BI). SSBI has made it easier for end users to access their data and create various visuals to get better business insights. Anybody who has basic understanding of the data can create reports to build intuitive and shareable dashboards. 2). What are the parts of Microsoft self-service business intelligence solution? Ans: Microsoft has two parts for Self-Service BI  Excel BI Toolkit – It allows users to create interactive report by importing data from different sources and model data according to report requirement.  Power BI – It is the online solution that enables you to share the interactive reports and queries that you have created using ...