
Running sum/ running total using TSQL

What is running sum ?

Running sum is basically sum of all previous rows till current row for a given column. The rows can be ordered/indexed on certain condition while collecting the sum. 
Below is the example where we collect running sum based on transaction time (datetime field) 


On Running_Sum column you can notice that its sum of all rows for every row.

How can you obtain running sum in SQL ?

Using SQL windowing function 

We will create a table with transaction data as shown above and try to obtain running sum. 

Syntax for running total  

SUM(<COLUMN>) OVER (PARTITION BY <COLUMN(S)> ORDER BY <COLUMN(S))

Since in our example we don't have any group to get running total so we will not use PARTITION BY. 

Lets jump into example 

We have created a table variable and added values and we are ready with data to be validated.


Below you can copy the code for above example. 

DECLARE @Running_Total_Example TABLE
(
transaction_date DATE,
transaction_amount INT
)

INSERT INTO @Running_Total_Example (transaction_amount,transaction_date)
VALUES (10,'2021-01-01'),(15,'2021-01-02'),(12,'2021-01-03'),(13,'2021-01-04'),(15,'2021-01-05')

SELECT *,SUM(transaction_amount) OVER(ORDER BY transaction_date) AS Running_SUM FROM @Running_Total_Example ORDER BY transaction_date

Running sum by correlated subquery

We can obtain the running total using correlated subquery. We use the query if we do not have option of windowing function/clause to get running sum. 


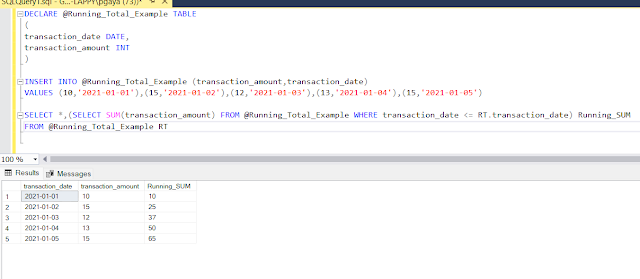
You can copy the code from below. 

DECLARE @Running_Total_Example TABLE
(
transaction_date DATE,
transaction_amount INT
)

INSERT INTO @Running_Total_Example (transaction_amount,transaction_date)
VALUES (10,'2021-01-01'),(15,'2021-01-02'),(12,'2021-01-03'),(13,'2021-01-04'),(15,'2021-01-05')

SELECT *,(SELECT SUM(transaction_amount) FROM @Running_Total_Example WHERE transaction_date <= RT.transaction_date) Running_SUM 
FROM @Running_Total_Example RT

Comments

Popular posts from this blog

DataZen Syllabus

INTRODUCTION TO DATAZEN PRODUCT ELEMENTS ARCHITECTURE DATAZEN ENTERPRISE SERVER INTRODUCTION SERVER ARCHITECTURE INSTALLATION SECURITY CONTROL PANEL WEB VIEWER SERVER ADMINISTRATION CREATING AND PUBLISHING DASHBOARDS CONNECTING TO DATASOURCES DESIGNER CONFIGURING NAVIGATOR CONFIGURING VISUALIZATION  PUBLISHING DASHBOARD WORKING WITH MAP  WORKING WITH DRILL THROUGH DASHBOARDS

PowerBI Interview Questions and Answers

Power BI Interview Questions – General Questions 1). What is self-service business intelligence? Ans: Self-Service Business Intelligence (SSBI) is an approach to data analytics that enables business users to filter, segment, and, analyse their data, without the in-depth technical knowledge in statistical analysis, business intelligence (BI). SSBI has made it easier for end users to access their data and create various visuals to get better business insights. Anybody who has basic understanding of the data can create reports to build intuitive and shareable dashboards. 2). What are the parts of Microsoft self-service business intelligence solution? Ans: Microsoft has two parts for Self-Service BI  Excel BI Toolkit – It allows users to create interactive report by importing data from different sources and model data according to report requirement.  Power BI – It is the online solution that enables you to share the interactive reports and queries that you have created using ...

MS BI Syllabus

Microsoft Business Intelligence Course Syllabus SSRS – SQL Server Reporting Services  Getting Started 1. Understanding Reporting (Authoring,Management,Delivery) 2. Installing Reporting (Native Mode, SharePoint Integration mode) 3. Building your first report  Authoring Reports 1. Developing Basic Reports (RDL,wizard,designer,datasource,dataset,formatting) 2. Working with expressions (expression to calculate value, Agg functions, exp for objects) 3. Organizing Data (Data Regions, Table, Matrix, Chart, List) 4. Advance Report (Parameter, drill down, drill through, links, 5. Report Model (Data Source, Data Source View, Model , Report Builder 3.0)  Managing Report ( Report Manager) 1. Managing Content (deploying report, folders, linked reports, datasources, value etc) 2. Managing Security (Item Level , Site navigation, localhost – sql) 3. Managing Server Config (Config Manager, Report Manager, Report Server DB)  Delivering Report 1. Accessing Report (Viewing...